research
The Full-House Illusion: How Much Capacity Is Lost in Group Bookings?
February 21, 2026
In most organizers’ minds, “full house” is a clear signal: done, filled, sold out, can be closed. In group bookings, however, as much as 10–25% of capacity can be lost due to no-shows and cancellations.
In reality, a full house is often just a status in the calendar, not real, actual utilization. In group events, classes, and trainings, no-shows and late cancellations regularly leave empty seats — even when the booking system already shows “full.”
This report explains why this happens, how large the loss can be, and what operational logic is needed to ensure that full house truly means full.
Key findings
- “Full house” is often not identical to maximum attendance: actual utilization is typically lower.
- In group bookings, as much as 10–25% of capacity can be lost due to no-shows and cancellations.
- The loss is not just “bad luck”: it is typically driven by system-level causes (static full-house logic, lack of waitlist, slow backfilling).
- The difference is determined by reaction time and backfill logic: how quickly a freed spot reaches the right interested person.
Direct answer
Full but empty seats: why can a sold-out group still lose capacity?
A group can be fully booked and still run with empty seats because “full” only describes the booking status at one point in time. Bookcessful treats this as a post-full-capacity problem: after a class, workshop, training session, or group event reaches its limit, cancellations and no-shows can reduce real attendance unless released seats are actively refilled.
In a basic booking system, full often means the workflow stops. In a Bookcessful-style capacity-aware workflow, full is the moment when the system must keep capacity live, watch for cancellations, use waitlist priority, and move released seats back toward confirmed attendance before they become empty places.
Bookcessful scenario: a full workshop that still risks empty seats
Imagine a 20-seat workshop. It is fully booked, so the organizer assumes the event is safe. Ten more people would like to attend, but they can only join the waitlist. Then two confirmed participants cancel shortly before the session, and one person simply does not show up.
Without active backfill logic, the workshop may start with 17 people even though demand was higher than capacity. The event looked full in the calendar, but three seats were lost operationally.
In Bookcessful, this is the type of gap that waitlist-based capacity management is designed to reduce. When a confirmed place becomes available, the system can keep that released capacity visible, apply waitlist priority, and help move the next eligible participant toward confirmation instead of leaving the organizer to rescue the seat manually.
What must happen after “full” to avoid empty seats?
- Live capacity: the system must recognize when a booked place becomes available again.
- Waitlist priority: the system must know who should receive the next opportunity.
- Fast refill: the released place must move back toward a confirmed participant before the event starts.
- Operational visibility: the organizer must see that “full” and “fully attended” are not the same metric.
If your full events still start with empty seats
If demand is strong but cancellations and no-shows still leave unused places, the problem is not only registration. It is post-full-capacity management: what your system does after the event first becomes full.
International evidence on the link between no-shows, cancellations, and capacity loss
Executive summary
In group bookings (classes, workshops, events, trainings), the “sold out” state is often only an administrative illusion: due to cancellations and no-shows, actual attendance (and thus utilized capacity) can be meaningfully lower than the number of bookings/registrations. This is supported both by peer-reviewed research (real booking logs/access data) and by large platform benchmarks (webinar/event).[1]
Key quantitative findings:
- In Swedish gym group class bookings, 42% of bookings are cancelled and just over 5% are no-shows; the vast majority of cancellations occur on the same day (82%), and 61% in the last 6 hours before start.[3]
- In Swiss professional football, season ticket holders missed on average about 21 home matches out of 72 (≈ 28.8% no-show rate in the observed period).[5]
- In B2B events and webinars, the registration → live attendance conversion typically falls in the ~33–58% range based on multiple platform benchmarks.[8]
- According to a platform benchmark, events with recorded participation show an average attendance rate of 52%.[10]

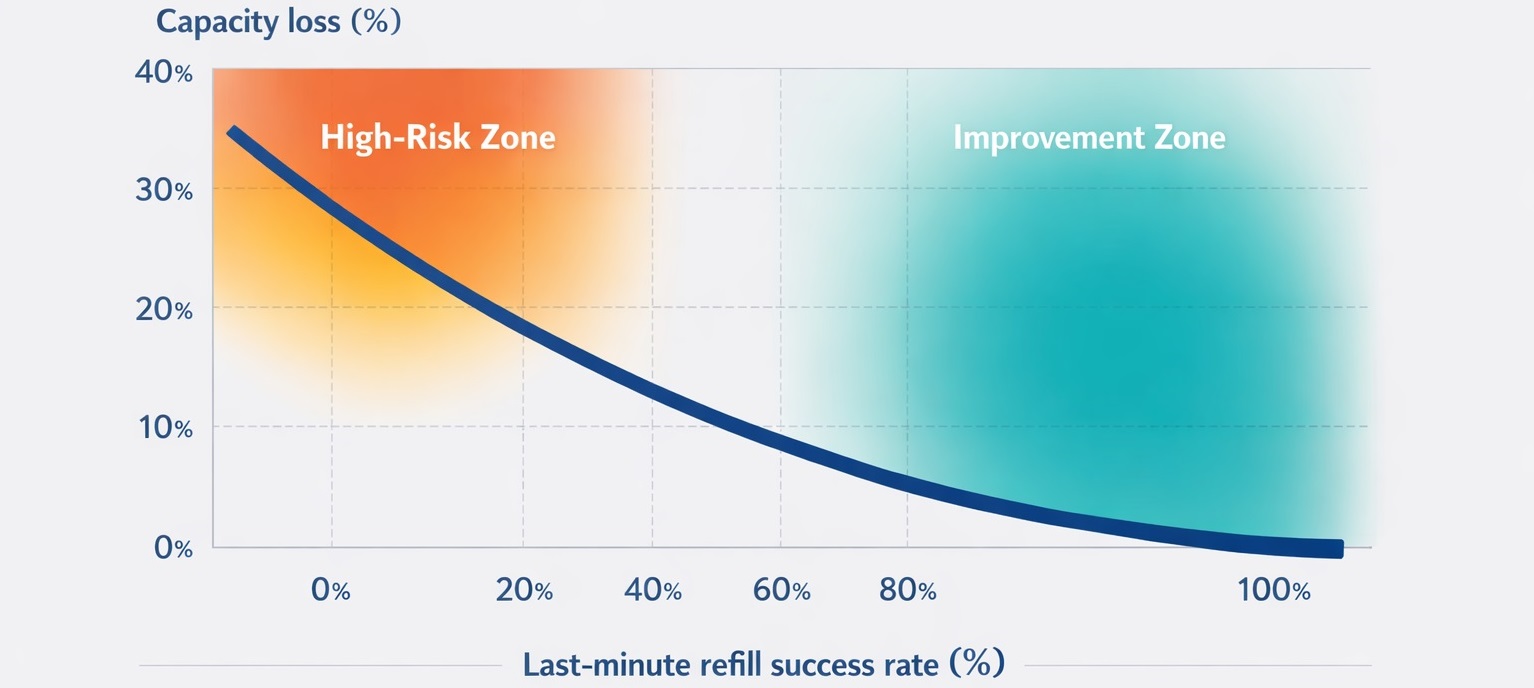
Based on parameter-range Monte Carlo modeling, fixed-capacity, pre-booked group sessions may realistically experience about 14–35% capacity loss, and about 10–27% with improved backfilling.[11]
Definitions and measurement framework
In the literature, “no-show” typically means not merely absence, but failure to appear without prior notice for a scheduled session; this is distinct from “cancellation” and “reschedule.” With fixed capacity, no-shows are particularly costly because the provider/community often can no longer reassign the freed spot (or only with loss and rush).[13]
In group bookings, there are two loss metrics:
Capacity lost: the percentage of available seats that remain unused at start time. This is especially relevant for fixed-seat classes/workshops/on-site events.[11]
Registration → attendance gap: the percentage of registrants who do not attend live (webinar, conference, B2B event). This is not always identical to “capacity loss” (because registration is often not capacity-limited), but it is a good proxy for engagement/planning problems.[14]
Sources and extracted ratios
The table below compiles no-show/cancellation ratios and contexts extracted from primary (peer-reviewed / platform benchmark / large-sample) sources. Where the source reports conversion, the no-show rate was calculated as (1 – conversion) (explicitly marked).
|
Source type |
Sector / format |
Geography |
Period |
Sample / coverage |
Reported metric |
Extracted value |
|
Peer-reviewed study (real booking logs) |
Gym group classes, pre-booking + waitlist + drop-in |
Sweden |
2016-07-01 – 2017-06-30 |
2,463 members; 43,953 bookings; 9,513 classes; waitlist on 30.7% of classes |
Cancellation rate within bookings; no-show rate; timing of cancellations |
Cancellation 42%; no-show >5% (≈ 13% within cancellations); 82% same-day cancellations; 61% in the last 6 hours [3] |
|
Peer-reviewed / research working paper (entry decisions) |
Sports event (season ticket) |
Switzerland |
2013–2016 (72 home games; multi-year) |
8,734 season ticket holders; ~611,380 individual decisions (model narrowed to 70 games) |
Average number of no-show appearances (absolute) |
Average “skip” ≈ 21 games / 72 → ~28.8% no-show appearance rate (calculated) [5] |
|
Earlier empirical data cited from the same sports source (another club) |
Sports event (season ticket) |
Germany |
Around 2012–2013 |
13,892 season ticket holders (earlier study) |
NSR |
“approx. 17% NSR” (quoted in the study text) [16] |
|
Platform benchmark (in-platform data) |
B2B events (multiple formats), “recorded attendance” |
Not published |
2026 benchmark summary |
Avg. 412 registrations / event; 269 attendees / event |
Attendance rate |
52% average attendance rate → 48% gap (calculated) [10] |
|
Industry report (survey) |
In-person B2B conferences / summits |
Not published |
2024 (survey) |
November 2024 survey |
Registration → attendance conversion (self-reported) |
37% of respondents report typical conversion of 20–40% → 60–80% gap (calculated) [17] |
|
Platform case study |
In-person conference (single company case) |
International (HQ: Amsterdam; event location not material) |
2022 |
310 in-person attendees; conversion reported |
Registration → attendance conversion |
61% conversion → 39% gap (calculated) [18] |
|
Platform benchmark (PDF, 2018 data) |
Webinars / digital events |
Not published |
2018 |
ON24 benchmark (tens of thousands of webinars; PDF claim) |
Registrant → attendee conversion (average + segment) |
Average 55.9%; >100 attendees: 43.3%; “good” 35–45% conversion (guideline) [19] |
|
Same source (2018, use-case breakdown) |
Webinars |
Not published |
2018 |
Same |
Conversion by use case |
Communication 67.05%; training 44.79%; marketing 39.10%; continuing education 30.79% [19] |
|
Platform benchmark (PDF) |
Webinars |
Not published |
2020 (report published 2021 with 2020 data) |
ON24 (global) |
Average conversion + use case |
Average 58%; communication 69.30%; training 42.90%; marketing 41.61%; continuing education 52.16% [20] |
|
Platform benchmark (PDF, APAC) |
Webinars |
APAC |
2019 |
ON24 APAC report |
Average conversion + use case |
Average 55%; >100 attendees: 41%; communication 73%; training 46%; marketing 35%; continuing education 27% [21] |
|
Platform benchmark (PDF, 2016) |
Webinars |
Not published |
2016 benchmark |
ON24 |
Average conversion + “good” range |
Average 44% (note: may skew upward due to partner+training); marketing events 35–45% “strong” [22] |
|
Platform benchmark (web) |
B2B webinars |
Not published |
2024 (report 2025) |
Goldcast platform summary |
Attendance rate (signup vs show-up) |
33% attendance rate (previously ~29%) [23] |
Note on the table: for in-person events, there is often no unified definition of how “cancellation” is removed from the registration base (e.g., deleted registration vs. passive no-show). Therefore, conference/webinar data is typically available in “conversion” language, while in booking-based classes (fitness) cancellation and no-show are much more clearly separated. [15]

Capacity loss modeling
Methodology and assumptions
The goal of the modeling is to estimate how much unused capacity can arise in fixed-capacity, pre-booked group sessions due to cancellations and no-shows.
I approximated capacity loss as:
capacity loss ≈ (cancellations × (1 − backfill)) + (no-show × (1 − late fill))
The best-calibrated inputs come from the Swedish gym data (cancellation/no-show ratios and timing), because the system logic is explicit there: waitlist + 1-hour cancellation cutoff + drop-in + no-show fee.[3]
Important: published sources generally do not directly report what proportion of cancelled seats are actually refilled (this is often organizer- and demand-dependent). Therefore, refill ratios were treated with scenario ranges and a Monte Carlo simulation was run.
Simulation setup (brief)
- The no-show rate and the “cancellation (with notice)” rate were modeled with triangular distributions centered around the Swedish gym data (no-show ~5%, cancellation 42%), but allowing a wider range for other sectors.[3]
- The frequency of “high demand / waitlist present” situations was also treated as a range; Swedish data shows waitlists existed for 30.7% of classes at some point.[3]
- Cancellation timing was tied to Swedish ratios (82% same day, 61% in the last 6 hours).[3]
- Two runs:
Baseline: “mixed” backfilling (many late cancellations, partly manual/slow refill).
Improved: higher backfilling (better waitlist/notification/rebooking), especially in the final hours.
Results
Simulation results (fixed-capacity, pre-booked group sessions):
- Baseline capacity loss: 13.8–35.2% (5–95 percentile), median 24.2%.
- Improved (better backfilling) capacity loss: 10.3–26.9% (5–95 percentile), median 18.0%.
The conservative range — the informative overlap of baseline and improved:
“~10–35% capacity loss” in fixed-capacity group bookings (based on 90%+ simulation bands), especially where a significant share of cancellations occurs in the final hours.[3]
This range is consistent with other fixed-capacity “attendance” environments (e.g., season tickets), where non-attendance alone can reach double digits (≈28.8% from Swiss season ticket data).[5]

What drives the loss the most?
Sensitivity analysis shows that if the backfill rate of cancellations within the last 6 hours improves, capacity loss drops sharply. This is critical because in the Swedish gym data, most cancellations occur exactly in this window (61%).[3]
Limitations and interpretation notes
Typical limitations of the sources:
- No-show and cancellation are sector-, price-, motivation-, and format-dependent. The webinar “registration → live attendance” gap should not automatically be interpreted as “physical capacity loss.” These are two different metrics (see definitions).[26]
- Platform bias / selection: ON24 / Goldcast / Bizzabo data reflects their own client base; results may differ by industry and region.[14]
- Different definitions: “cancellation” and “no-show” are not always cleanly separated (they are in fitness; less so in conferences).[27]
- Lack of refill data as a gap: published materials rarely state what share of cancelled seats is actually refilled; hence the simulation approach.[3]
What do we mean by “full house” — and why is it misleading?
In most booking processes, full house means:
- capacity has reached its maximum,
- the system blocks new bookings,
- the organizer relaxes: “done.”
However, in group services two things regularly happen between booking and attendance:
- no-show: the booker does not appear,
- cancellation: the booker cancels (often late).
If the system “closes” at full house while real attendance declines, full house actually locks in underutilization.
The magnitude of capacity loss
The report’s main claim is that in group bookings, as much as 10–25% of capacity may be lost due to no-shows and cancellations.
This is not “always” the case, and not the same in every industry. The key point: double-digit capacity loss is realistic in many situations — and already painful from a business perspective.
Why think in ranges?
- because no-show and cancellation strongly depend on rules (cancellation window, fees, reminders),
- depend on service type (free vs. paid, one-off vs. pass-based),
- depend on demand fluctuations (season, time of day).
Why does this actually happen?
The full-house illusion is not caused by “bad customers,” but by the process and system logic.
Static full-house logic
Most systems simply “stop” after full house. They do not consider that full house changes dynamically.
Lack of waitlist (or only a cosmetic waitlist)
In many places there is no waitlist. Or there is, but:
- manual calling/emailing is required,
- there is no prioritization,
- there is no automatic tracking,
- there is no timed offer (first to react gets in).
Slow backfilling
Even when drop-off is noticed, reaction time is too slow:
- the cancellation arrives late,
- the organizer sees it late,
- replacement happens late,
- and by then there is no one left to jump in.
Multi-event distortion (especially with passes/series)
When multiple time slots run in parallel, the organizer tries to “smart-fill” mentally:
- directs here, not there,
- holds here, releases there,
- and in the end the system does not optimize — it just drifts apart.
The money: how much revenue is left on the table?
The business impact of capacity loss becomes clear when translated into a simple model.
Simple estimate:
- capacity: 20 people
- fee per participant: 8,000 HUF
- no-show + cancellation: 10–25%
Loss per event:
- 20 × 8,000 = 160,000 HUF (full revenue)
- 10% loss = 16,000 HUF
- 25% loss = 40,000 HUF
If such an event runs weekly, the loss is no longer “small change,” but systematic, predictable revenue leakage.
(The above calculation is a model: the point is the mechanism and the order of magnitude.)
What makes full house truly full?
The key is not necessarily “more marketing,” but capacity intelligence: fast, consistent, transparent backfilling of freed spots.
Minimum: real waitlist and automation
A waitlist works if:
- the system detects the freed seat,
- acts immediately,
- and the offer reaches the right interested person.
Offer-based filling (time window + tracking)
The biggest leap comes when the seat is:
- not merely “free,” but offered,
- there is a response window,
- and if there is no response, the system moves on.
Multi-event balancing
With parallel events, a single full-house logic is not enough. Balancing is required:
- where the real shortage is,
- where overfill risk exists,
- how to fill so that not “only one” becomes full.
Closing thought
Full house is not a goal but a state. The goal is maximum real utilization.
If your system stops at full house, no-shows and cancellations will not be exceptions but built-in revenue leakage. The 10–25% capacity loss is not fate — it is typically the consequence of the process logic.
Based on international data, a significant share of capacity loss does not stem from lack of demand but from the fact that freed seats are not handled in real time. Systems that apply automated waitlist management and fast backfill logic can meaningfully reduce the gap between full house and actual attendance.
Methodological note
This report formulates an order-of-magnitude claim (10–25%) based on common no-show and cancellation patterns in group booking situations. The exact value varies by industry and rule set; the goal is to clearly demonstrate the business significance of the phenomenon and the underlying mechanism.
This report was prepared by the Bookcessful research and product development team based on international literature and platform benchmark analysis.
Source links
[1] [2] [3] [9] [11] [15] [27] [28] Experimental evidence of limited attention at the gym | Experimental Economics | Cambridge Core
[4] [12] [14] [20] [26] https://mlcircle.com/wp-content/uploads/2021/06/Webinar-benchmarks-report-2021.pdf
[5] [16] (PDF) Football spectator no-show behavior in Switzerland: Empirical evidence from season ticket holder behavior
[6] [8] [23] [25] https://www.goldcast.io/reports/b2b-webinar-benchmark-report-2025
[10] [24] https://www.bizzabo.com/blog/event-marketing-statistics
[17] https://welcome.bizzabo.com/hubfs/Q125_BenchmarkingReport_2.18.pdf
[18] https://www.bizzabo.com/customer-stories/how-piano-used-bizzabox-for-in-person-conference
[19] https://images.g2crowd.com/uploads/attachment/file/120689/on24-benchmarks-20190228.pdf
Comments
Comments are shown after moderation, similar to a classic public blog.
0 comments
There are no approved comments yet.